Water Dots

Here is a map showing the area covered by water for US Census Tracts. Each dot represents the surface area of 20 Olympic-sized swimming pools (because I, like most people probably, suck at visualizing/comprehending big square meter numbers). Here is a simple how-to, including a poignant letter penned to my old friend, Dot Density. Happy … Continue reading Water Dots

Felt Map

Some time ago, while I was working on a wood-looking map of undersea cables, my 10-year-old daughter Willow, who was mightily into the movie Trolls at the time, told me my map should be made out of felt instead of wood. So, here is that map, using a photo of a swatch of her craft … Continue reading Felt Map

There And Back Again. Dad’s Map as a path from digital to drawn and back to digital

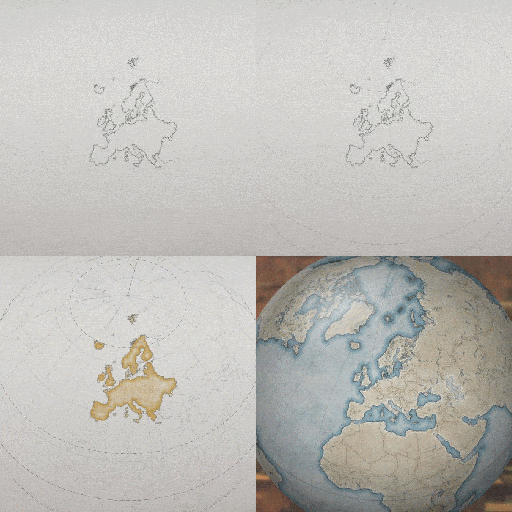
I’ve been into hand drawing maps lately, to give as gifts. What a blast. I’ve found that the process is pretty cyclical, though as I use a GIS to prep for a hand drawn map, and then later was inspired by the results to create texture resources for GIS so I could make hand drawn … Continue reading There And Back Again. Dad’s Map as a path from digital to drawn and back to digital

CFB Championship

Well, we have an all-SEC (yaaaawwwnnn, oh, pardon me) championship game. Here are how the two teams compare, by way of in-state players and Air Mile Index, by class… Actually, it is a pretty interesting match-up of recruiting footprints; the two programs have much different patterns. Alabama’s Air Mile index is typical of a top-tier … Continue reading CFB Championship