The maps of the Bruised Borders story are a combination of a customized vector tile basemap and border polygons with image texture fills, assembled in ArcGIS Online.
The cartographic theme is that of actively wounded boundaries between nations. The basemap looks a little like skin, and the disputed boundaries are meant to resemble abrasion. A bit kitschy? Probably. More interesting than dashed lines? Yes.
The Basemap
The basemap is a customized vector tile set, based on the Light Gray Canvas style, called Khaki. Using the JSON editor, I stripped the layers down to a handful of areas, boundaries, and references, and swapped out the varying gray tones for a reduced set of khaki hues. The resulting basemap is a much simpler background for thematic maps, and has a smaller palette -with a tan.
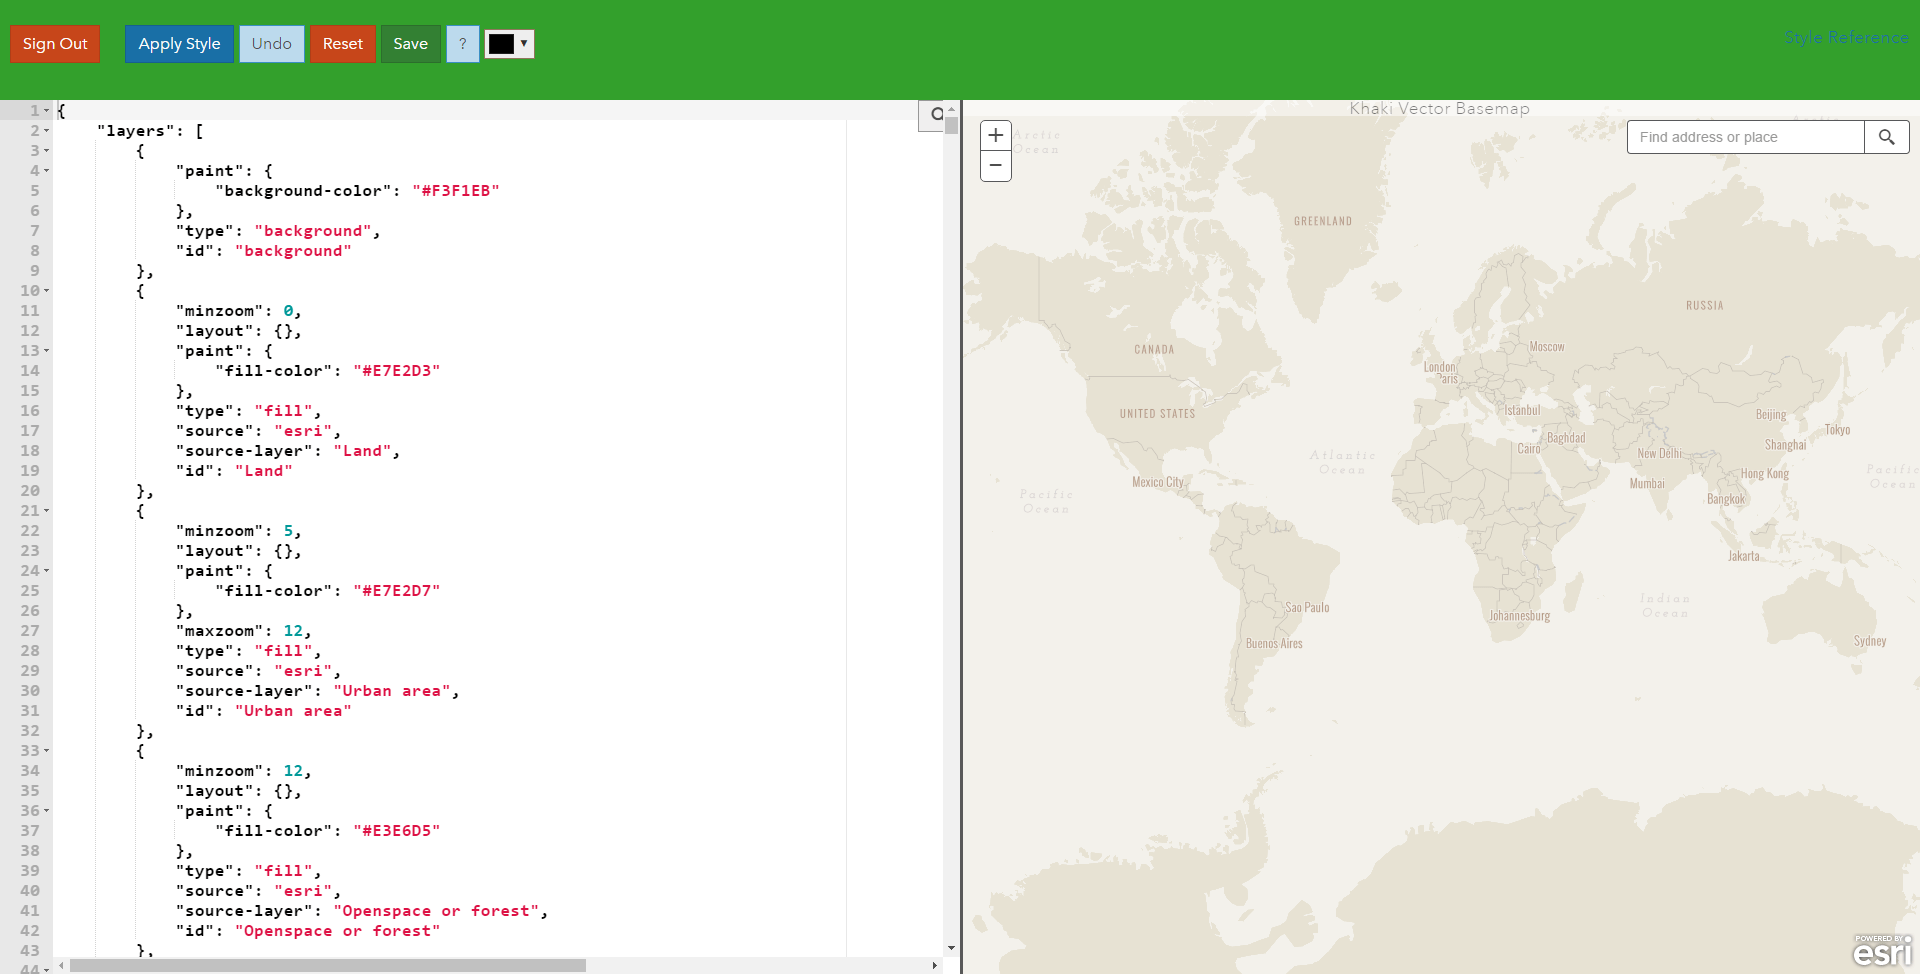
Land feature labels use Oswald Light, a firm-but-fair compact font that’s all, I’m no nonsense -boom, job done; what else needs labeled? Water features use Josephin Slab Italic, a light weight lettering with lots of leading between characters that’s all, sure I have these serifs, but I know how to have fun, too.

The Borders
In order to get an abrasion effect for the border areas, I created a set of buffered polygons around disputed borders. Then I used a hatch image, at varying orientations and colors, to stack them up into a scored-looking thing that fades at the edges.

ArcGIS Pro has a wealth of polygon fill hatches to choose from, but they had the good sense not to include a rough, scraped, jaggy-looking option. No worries! You can use an image to paint a polygon fill. Plus you can tint, scale, and rotate it. That’s where the bruising begins. It’s an irregular “x” shape. Parts more transparent than others, for variability. It’s only 9×9 pixels, and mostly invisible, but you can right-click these here words and save the image yourself.
Here’s a really zoomed-in look at my hatch image.

And here, I’m using the image to fill the buffered polygons (5, 10, 15, and 20 miles, respectively). In addition to a shifting hue, each layer rotates and scales the image slightly. Head’s up, the “tint” effect in Pro is applied to the whiteness of an image. So my “x” texture had to be white in order to assign it a color.

When the buffers were all styled up, I uploaded them to ArcGIS Online (right-click > “share as web layer”), and set their sharing status to “public” so others could see it.
When you open the feature service in an ArcGIS Online web map, the hatchy-colored-scratchy-image-fill style is supported. Boom, done! Except for the six or seven times I had to make tweaks to the geometry or style and re-upload them. You know how it goes.
Assembly
Once the vector tiles and layers were ready, I assembled them in an ArcGIS Online map. Sandwiched between the basemap and the dispute layers, is a faint hillshade layer. Topography plays such an important role to so many of the disputes that the smooth basemap was lacking in that dimension of the story.
I dragged the transparency of the scratchy disputed borders to 70%, then added a vector line feature for the borders, themselves, so the fancy-pants effect didn’t get in the way of actually seeing where the borders are. This border line was painted a deep crimson and dashed. All of those options are available to set up directly in the web map.

In ArcGIS Online, you can clean up the pop-up information that appears when a reader clicks on a feature. I turned all of the pop-ups off for the bruise buffers, and configured a basic Pop-up for the boundary line, itself, showing the conflict name, short description, and link to a Wikipedia page with the specifics of that conflict.
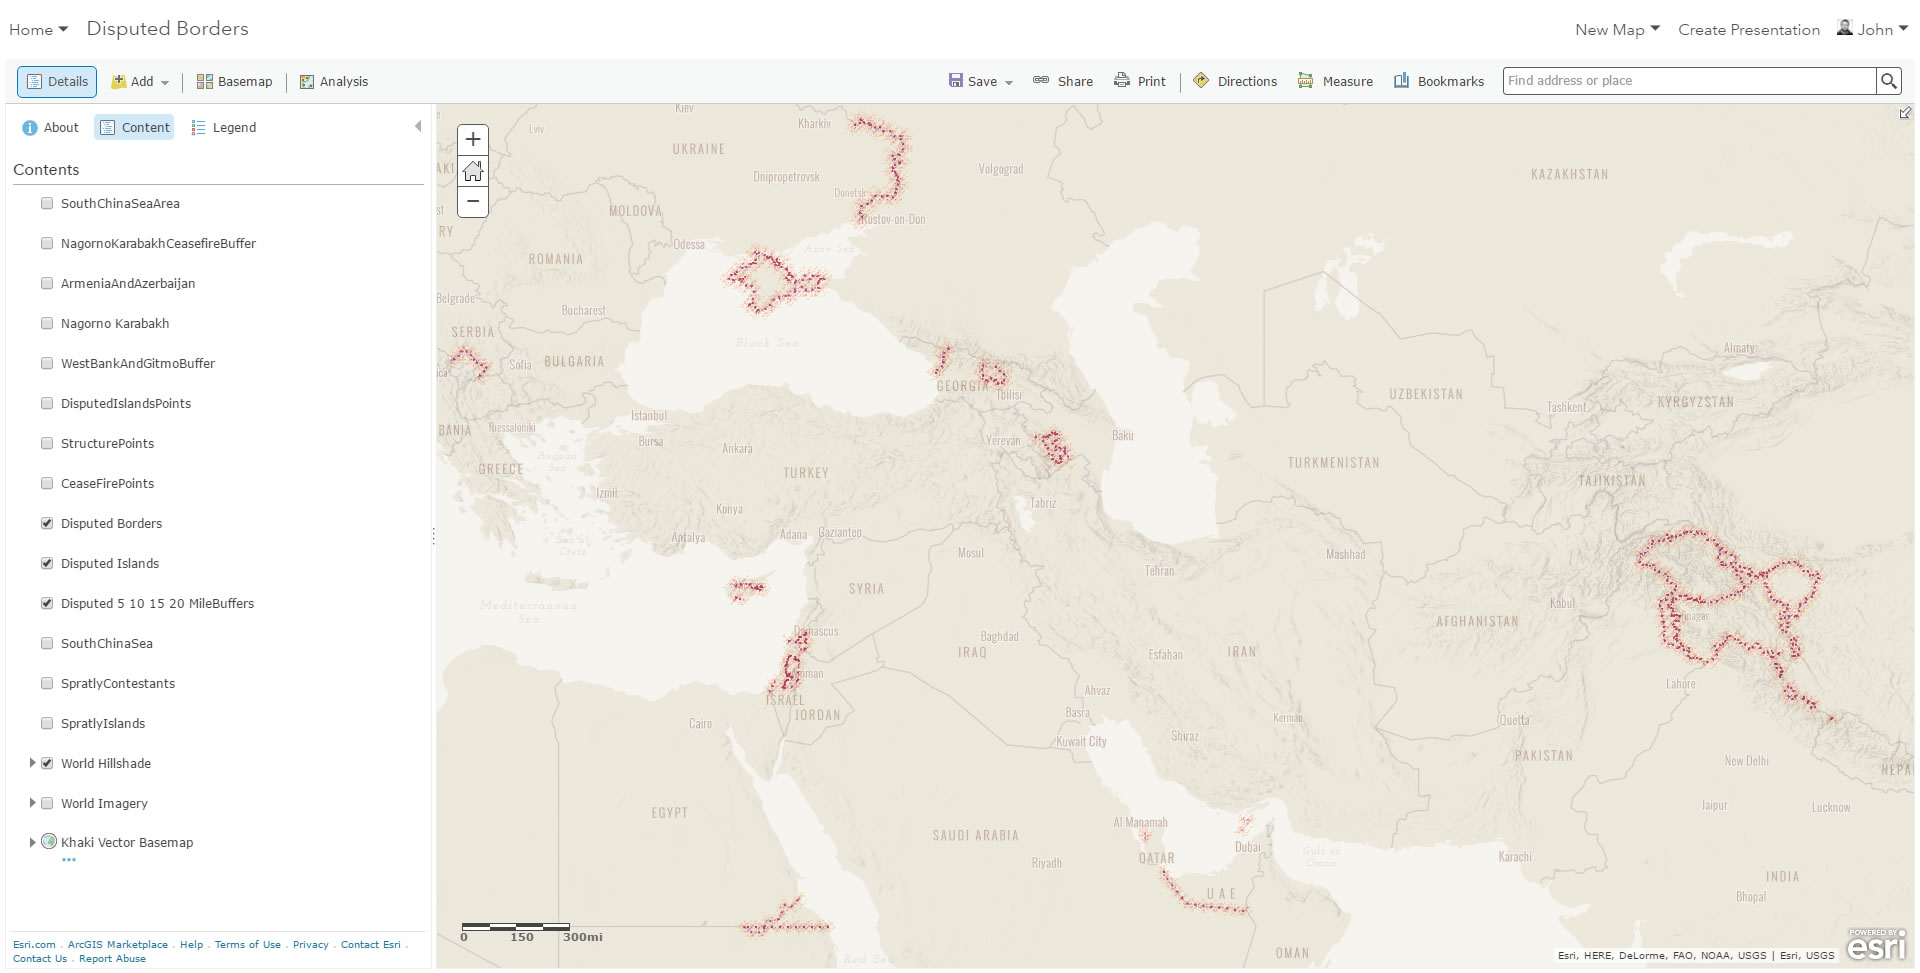
Additionally, sections of the story focus on point features (interesting border structures, cease-fire points, and islands), which would be impossibly small at wide scales, so I created a special point feature, with an image symbol for those. Rather than an image that covered up the small location, itself, these symbols are a ring graphic, in the same style, appearing to circle the location, rather than occlude it.

Story Map-ification
Once this web map had all of the components, I could bring it into a Cascade story map and set up various views (zoom extent and visible layers) to couple with the narrative content that zips by.

And that’s that! That’s the cartography of Bruised Borders.
And many thanks for the insights and advice from actual cartographic experts, Allen Carroll, Cooper Thomas, David Asbury, and Alex Tait.
Happy Mapping! John
One thought on “The cartography of the Bruised Borders story”